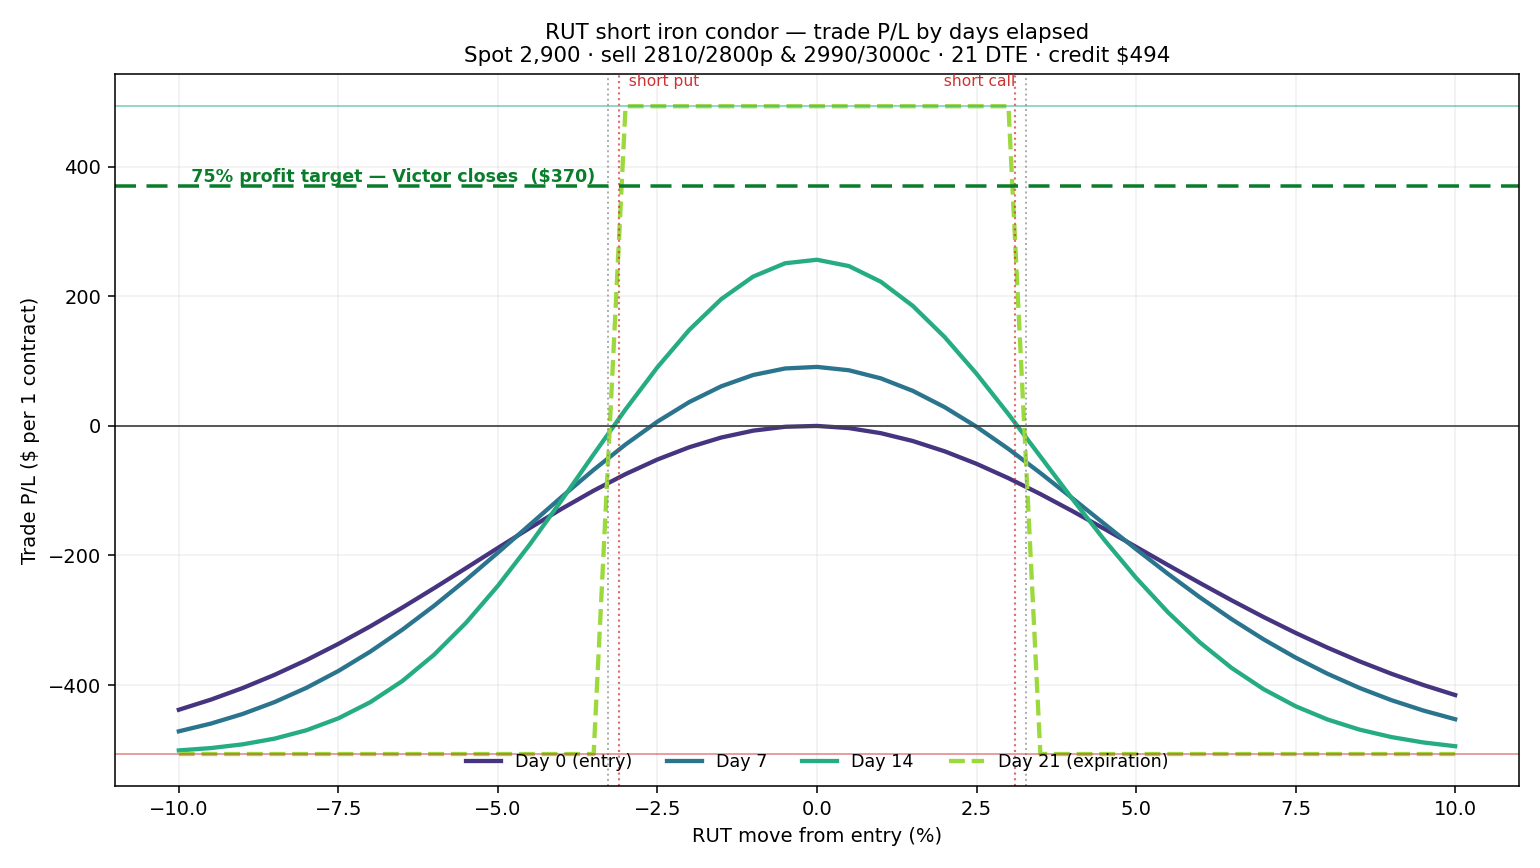
RUT short iron condor — value of the trade, day by day
The dashed green line is the
75% profit target — when the trade's value reaches it, Victor closes. Drag the slider to step
from entry (day 0) to expiration. The dashed
grey line is the expiration payoff for reference; the coloured line is the trade's value on
the selected day. Vertical red dotted lines mark the short strikes; grey dotted lines mark
the breakevens.
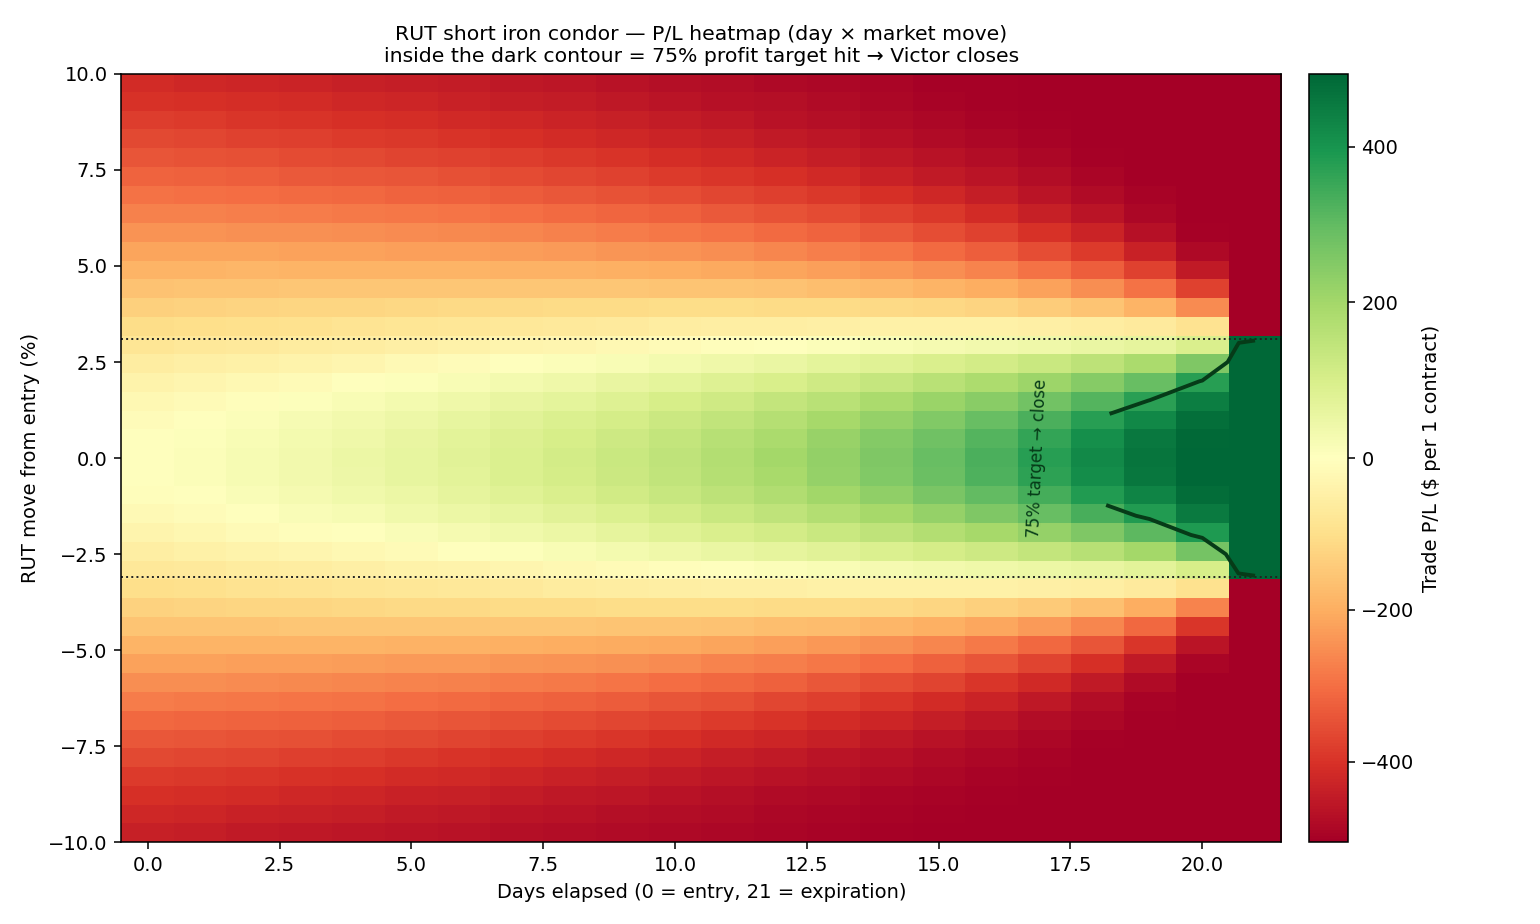
Every cell = the trade's P/L on that day if RUT is that far from the entry
level. Green = profit, red = loss. The dark outline rings the 75% profit-target zone —
once the trade lands inside it, Victor closes.
Printable charts (same data, for email or a quick glance)
Downloads.
Excel grid (.xlsx) ·
value curves (PNG) ·
heatmap (PNG)
The Excel file has the full day × 0.5%-move grid and is editable.
Assumptions. Black-Scholes on RUT (European, cash-settled) with a flat implied vol;
$100/point; IV held constant as price moves (ThinkorSwim's default). ToS uses live
per-strike IV and your actual fill credit, so to match it exactly, set
SPOT
and IV in generate.py to the live chain and re-run. One caveat the
flat-IV model understates: in a real selloff, put-side IV rises, so the red zone on the downside
would be deeper than shown.